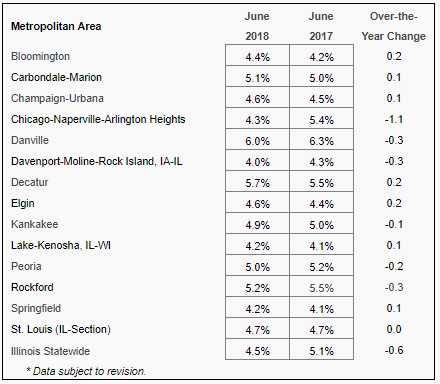
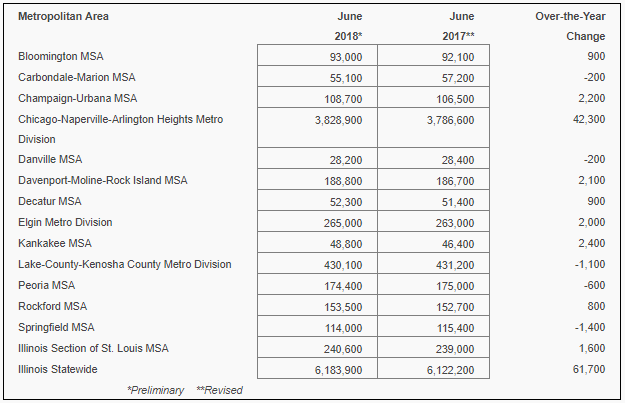
CHICAGO – Unemployment rates decreased over-the-year in June in six of Illinois’s metropolitan areas, increased in 7 and was unchanged in one, according to preliminary data released today by the U.S. Bureau of Labor Statistics (BLS) and the Illinois Department of Employment Security (IDES). Data also show nonfarm jobs increased in nine of the metropolitan areas.
“The increase in the unemployment rate in seven of the metros was largely due to an increase in the overall labor force brought on by renewed confidence in the local economy,” said IDES Director Jeff Mays. “Many people that were unemployed are now out looking for work as more jobs are available.”
Get The Latest News!
Don't miss our top stories and need-to-know news everyday in your inbox.
Illinois businesses added jobs in nine metro areas, with the largest increases in: Kankakee (+5.2 percent, +2,400), Champaign-Urbana (+2.1 percent, +2,200), and Decatur (+1.8 percent, +900). Total nonfarm jobs in the Chicago-Naperville-Arlington Heights Metro Division increased (+1.1 percent or +42,300). Illinois businesses lost jobs in five metro areas with the largest losses in: Springfield (-1.2 percent, -1,400), Danville (-0.7 percent, -200), and Carbondale-Marion (-0.4 percent, -200).
The industry sectors recording job growth in the majority of metro areas included Transportation, Warehousing and Utilities (10 of 14), Education and Health Services (10 of 14), Manufacturing (9 of 14), Professional and Business Services, (9 of 14), and Leisure and Hospitality (9 of 14).
Not seasonally adjusted data compares June 2018 with June 2017. The not seasonally adjusted Illinois rate was 4.5 percent in June 2018 and stood at 12.2 percent at its peak in this economic cycle in January 2010. Nationally, the not seasonally adjusted unemployment rate was 4.2 percent in June 2018 and 10.6 percent in January 2010 at its peak. The unemployment rate identifies those who are out of work and looking for work, and is not tied to collecting unemployment insurance benefits.
Metro East Highlights
Help Wanted
Area employers advertised for 7,500 openings in June and approximately 81 percent sought full-time employment, according to Help Wanted OnLine data compiled by the Conference Board. It is a global, independent business membership and research association. Employers actually need more workers than the help wanted ad indicates because some industries, such as construction, typically do not advertise job openings.
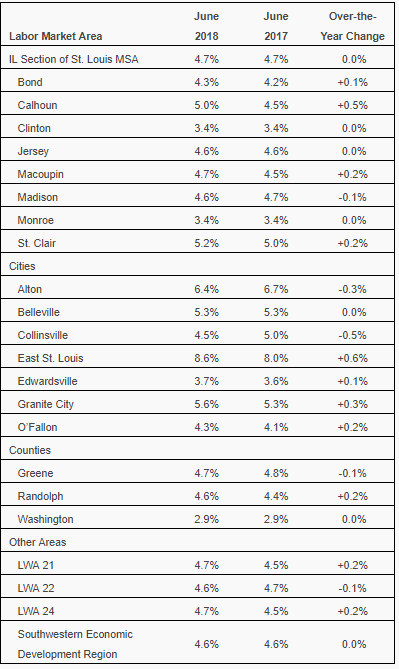
The June 2018 unemployment rate for the Illinois Section of the St. Louis Metropolitan Statistical Area was 4.7 percent, no change (0.0%) from the June 2017 rate of 4.7 percent. The data is not seasonally adjusted.
The number of employed individuals increased by +8,422 to 336,068 in June 2018 from 327,646 in June 2017. The labor force increased by +8,995 to 352,626 in June 2018 from 343,631 in June 2017. In June 2018, there were 16,558 unemployed people in the labor force. This is an increase of
573 compared to the June 2017 total unemployed of 15,985.
Over the year, nonfarm payrolls increased by (+1,600).
Employment increased in Wholesale Trade (+1,000), Manufacturing (+500), Retail Trade (+400), Transportation, Warehousing, and Utilities (+300), and Professional and Business Services (+300) in June 2018 compared to June 2017.
Decreases in employment over the year included Educational and Health Services (-400), Financial Activities (-200), Mining and Construction (-100), Other Services (-100), and Government (-100).
Payrolls in Information and Leisure and Hospitality remained stable with no change over the year.
Note:
- Monthly 2017 unemployment rates and total non-farm jobs for Illinois metro areas were revised in February 2018, as required by the U.S. Dept. of Labor, Bureau of Labor Statistics (BLS). Comments and tables distributed for prior metro area news releases should be discarded as any records or historical analysis previously cited may no longer be valid.
- LWA— Local Workforce Area 21 is composed of Calhoun, Greene, Jersey, Macoupin, Montgomery, Morgan, Scott and Shelby Counties.
LWA— Local Workforce Area 22 is composed of Bond and Madison Counties.
LWA— Local Workforce Area 24 is composed of Clinton, Monroe, Randolph, St. Clair and Washington Counties.