
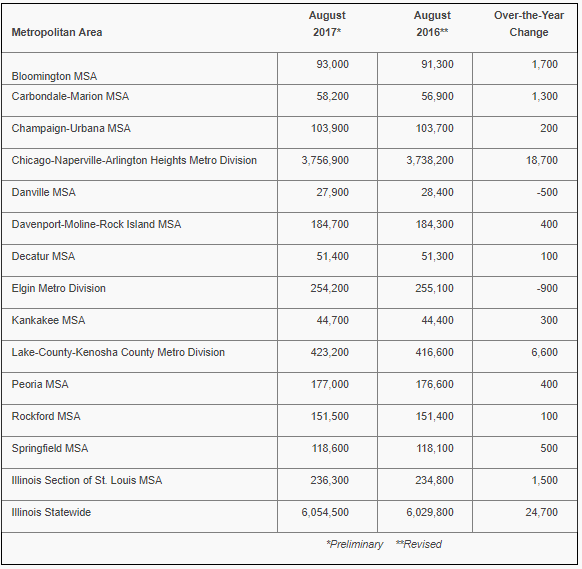
 CHICAGO – Unemployment rates decreased over-the-year in August in all of Illinois’s metropolitan areas and all but one county, according to preliminary data released today by the U.S. Bureau of Labor Statistics (BLS) and the Illinois Department of Employment Security (IDES). Data also show nonfarm jobs increased in twelve of the metropolitan areas and decreased in two.
“More areas showed job gains in August, but the pace of growth is not where we would like it to be,” said IDES Director Jeff Mays. “While it is encouraging that unemployment rates declined from last year, most areas in Illinois are still higher than the national average.”
Get The Latest News!
Don't miss our top stories and need-to-know news everyday in your inbox.
Illinois businesses added jobs in twelve metro areas, with the largest increases in: Carbondale-Marion (+2.3 percent, +1,300), Bloomington (+1.9 percent, +1,700), and Lake (+1.6 percent, +6,600). Total nonfarm jobs in the Chicago-Naperville-Arlington Heights Metro Division increased (+0.5 percent or +18,700). Illinois businesses lost jobs in two metro areas: Danville (-1.8 percent, -500) and Elgin (-0.4 percent, -900).
The industry sectors recording job growth in the majority of metro areas included Mining and Construction (10 of 14), Professional and Business Services (9 of 14), Educational and Health Services (9 of 14), and Leisure and Hospitality (8 of 14).
Not seasonally adjusted data compares August 2017 with August 2016. The not seasonally adjusted Illinois rate was 5.2 percent in August 2017 and stood at 12.2 percent at its peak in this economic cycle in January 2010. Nationally, the not seasonally adjusted unemployment rate was 4.5 percent in August 2017 and 10.6 percent in January 2010 at its peak. The unemployment rate identifies those who are out of work and looking for work, and is not tied to collecting unemployment insurance benefits.
Metro East Highlights
Help Wanted
Area employers advertised for 5,600 openings in August and approximately 79 percent sought full-time employment, according to Help Wanted OnLine data compiled by the Conference Board. It is a global, independent business membership and research association. Employers actually need more workers than the help wanted ad indicates because some industries, such as construction, typically do not advertise job openings.
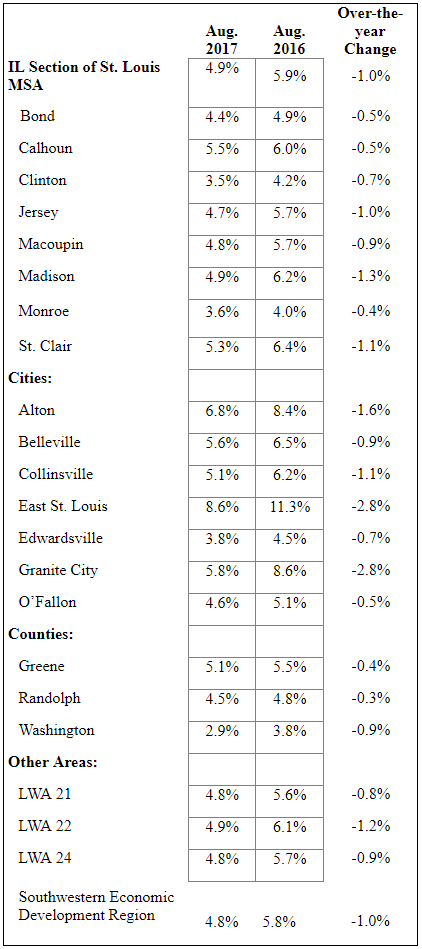
The August 2017 unemployment rate for the Illinois Section of the St. Louis Metropolitan Statistical Area was 4.9 percent, a decrease of (-1.0%) from the August 2016 rate of 5.9 percent. The data is not seasonally adjusted.
The number of employed individuals decreased by 983 to 324,301 in August 2017 from325,284in August 2016. The labor force decreased by 4,807 to 341,013 in August 2017 from 345,820 in August 2016. In August 2017, there were 16,712unemployed people in the labor force. This is a decrease of 3,824 compared to the August 2016 total unemployed, 20,536.
Over the year, nonfarm payrolls increased by (+1,500).
Employment increased in Transportation, Warehousing and Utilities (+1,100), Mining and Construction (+300), Leisure and Hospitality (+200), Manufacturing (+200), Retail Trade (+200) and Government (+100) in August 2017 compared to August 2016.
Decreases in employment over the year included Professional and Business Services (-200), Financial Activities (-100), Information (-100), Educational and Health Services (-100), and Other Services (-100).
There was no change in employment over the year in Wholesale Trade.
Note:
Monthly 2016 unemployment rates and total non-farm jobs for Illinois metro areas were revised in February 2017, as required by the U.S. Dept.of Labor, Bureau of Labor Statistics(BLS).Comments and tables distributed for prior metro area news releases should be discarded as any records or historical analysis previously cited may no longer be valid.
LWA— Local Workforce Area 21 is composed of Calhoun, Greene, Jersey, Macoupin, Montgomery, Morgan, Scott and Shelby Counties.
LWA— Local Workforce Area 22 is composed of Bond and Madison Counties.
LWA— Local Workforce Area 24 is composed of Clinton, Monroe, Randolph, St. Clair and Washington Counties.
More like this: