

What is Google Analytics and How Does it Work?
Google Analytics is a free website tracking tool and platform that collects data on how users interact with your website. Once the data is collected, Google Analytics sorts the data into easy-to-read interactive reports, which is what we see in the platform.
Get The Latest News!
Don't miss our top stories and need-to-know news everyday in your inbox.
To get any data from your website into Google Analytics, you must first place the tag on your site. We add this tag under an account when a website is published. As soon as that tag is properly placed, Google Analytics will start collecting data. The data is then put into reports made up of metrics (anything that can be measured with a number is a metric) and dimensions (how metrics can be segmented).
Finding the Data that Matters to You
There’s a lot of data reported in Google Analytics — like, a lot. Because there’s so much data available, it's really easy to get overwhelmed by all of the information and fall into analysis paralysis.
Some of the data collected includes:
How many visitors your pages get.
Where visitors come to your pages from.
How those visitors progress through your site.
What visitors do on your pages.
How visitors interact with elements on your pages.
How long visitors spend on your pages.
At what stage of a visit users leave your site.
What are Users, Pageviews, and Sessions in Google Analytics?
The following are definitions of some of the most important metrics put forth by Google Analytics:
- Users: A user represents a single person who comes to a given site.
- Pageviews: Pageviews count when a user loads a given page on your site. For instance, if a user were to reload the same page, this would count as an additional pageview. Pageviews are accumulated irrespective of users or sessions.
- Sessions: A session consists of every action taken by a single user during each site visit. Beginning when a user enters your site and ending when they leave, a session can show every page clicked through and every minute spent on each page.

Tracking Pageviews
Pageviews help webmasters determine what content on their site is the most popular among users. With this metric, webmasters know the most valuable location for their ads.
However, there is a bit of a gray area when it comes to pageviews. Tracking how many users visit a given page or how many pages a given user visits does not measure their actual engagement. Alone, they do not tell you if a user was so engaged that they visited multiple pages, or if that user couldn’t find what they needed and had to visit other pages. Tracking pageviews can help you understand behavior, but not intent.
Pageviews vs. Unique Pageviews
As mentioned above, pageviews represent the total number of times a given page is loaded on your site. Unique pageviews, on the other hand, amount to only the pages loaded by a single user, in a given session. A single user’s collection of pageviews is counted as one unique pageview.
Unique pageviews provide webmasters a more accurate gauge of where on their site their audience is going. Since the feature eliminates the noise created by reloading the same page, webmasters can tell what pages are actually driving the most traffic. By knowing what drives their traffic, webmasters know which pages to target with ads and calls-to-action.
The Highs and Lows of Bounce Rates
A bounce is a single-page session on your site; when a user opens a single page on your site and then exits without triggering any other requests to the Analytics server during that session.
Bounce rate is single-page sessions divided by all sessions, or the percentage of all sessions on your site in which users viewed only a single page and triggered only a single request to the Analytics server.
If the success of your site depends on users viewing more than one page, then a high bounce rate is bad. For example, if your home page is the gateway to the rest of your site (e.g., news articles, product pages, your checkout process) and a high percentage of users are viewing only your home page and then leaving, you don’t want a high bounce rate.
On the other hand, if you have a single-page site like a blog, or offer other types of content for which single-page sessions are expected, then a high bounce rate is perfectly normal.
Lowering Your Bounce Rate
If your overall bounce rate is high, then you can dig deeper to see whether it’s uniformly high or whether it’s the result of something like one or two channels, source/medium pairs, or just a few pages.
If just a few pages are the problem, examine whether the content correlates well with the marketing you use to drive users to those pages, and whether those pages offer users easy paths to the next steps you want them to take.
If a particular channel has a high bounce rate, take a look at your marketing efforts for that channel: for example, if users coming via display are bouncing, make sure your ads are relevant to your site content.
If the problem is more widespread, take a look at your tracking-code implementation to be sure all the necessary pages are tagged and that they’re tagged correctly. And you may want to reevaluate your overall site design and examine the language, graphics, color, calls to action, and visibility of important page elements.
Audience reports
Audience reports are exactly what they sound like: reports on who your audience is. If you’re interested in better understanding who is coming to your site, these are the reports you’re going to want to look at.
In this report, you can find the following dimensions:
Technology — What devices and operating systems are they using when coming to your site?
Demographic information — What gender are users? How old are they?
Geographic information — Where are your users located when accessing your site?
User trends — Do people come to the site more than once? If so, how often do they visit the site?
Understand your audience at a glance with the audience overview report. From here you can see the number of users that have visited your site, if users have visited your site multiple times and what language the user’s browser language operates in.

You can toggle the demographic and system options on this report to see the breakdown of user countries, cities, browsers, operation systems, and service providers.
Acquisition reports
Acquisition reports tell you how people are getting to your website. These are the reports that you’ll want to go to if you’re looking to track the effectiveness of your marketing efforts or to find opportunities for new marketing channels.
In acquisition reports, you can see:
Channels — What marketing channels are driving traffic?
Sources — What sites are referring people to your site?
When you want to see how people interact with your site after you send them there from social media, email newsletters, etc., this is where you’ll want to go.
Understanding where your users are coming from on the internet is useful when trying to track the value of your marketing. Acquisition reports can show you how users are finding/ navigating to your website.
In the overview you will be able to see, at a glance, the breakdown of your site traffic by marketing channel. In this view you can also see site users and conversion rates by day.
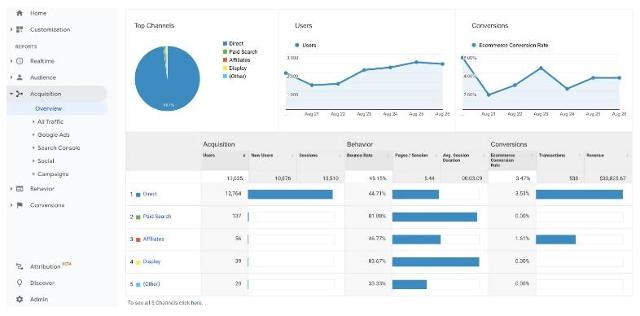
This highly visual report can help you see the channels that bring in the most traffic (acquisition), best engagement (behavior), and most conversions (conversions). It is important to note the defaults in this view, though.
Acquisition shows you the number of users, so the largest bar on the graph is driving the most traffic. The behavior section of the table is defaulted to show you the bounce rate. In this instance, the largest bar on the graph has the HIGHEST bounce rate, which is not necessarily a good thing. The conversions section, by default, shows the conversion rate. While the largest bar may have the highest conversion rate, it’s important to take into consideration how much traffic is actually attributed to that channel. If there were only two sessions and one converted, the conversion rate would be really high for a source that only led to one conversion.
In short, the ideal channel would have a large acquisition bar, small behavior, and large conversion bar. Or you could just change the selected behavior metric to either pages/ session or average session duration so that you could look for all large bars.
Behavior reports
Behavior reports can show you how people interact with your website. This is a great way to see what content people are enjoying, what they value, and more.
The dimensions of behavior reports include:
Landing pages — What page do people arrive at when entering your site?
Exit pages — What is the page people go to last before leaving your site?
Content — What are the most popular pages on your site? How do people interact with each of those pages?
Behavior flow — How do people navigate through your site? Does the navigation change based on source? Medium? Landing Page?
Understanding how users interact with your site and what their journeys consist of can help you create better content. If you want to know which pages are working and which may need some help, these are the reports you’re going to want to look at.
When creating content, the goal is generally to get people to interact with it. Whether that means people read a full article, click on a call-to-action, or watch a video, every page is looking for audience engagement. This engagement leads to a longer time on site and shows Google that your site is answering questions for the users.
In the behavior overview you will see either sums or averages of engagement. Pageviews and unique pageviews will both show sums, while all other metrics will show you site averages.
Under the summary metrics, you will see pageview breakdowns by content at different levels.

While there isn’t a ton of information in this view, it’s a good “at a glance’ report. You can get a general understanding of how people interact with your site from this page.
Conversion reports
Conversion reports show you when and if people are converting on your website. These reports only generate data if you have conversion goals set up.
Conversion reports will show you:
Goal URLs — Where were the goals completed? What percentage of visits to that page led to a conversion?
Goal path — What pages were visited before the goal was completed?
Goal flow — What sources led to most goal completion?
If you’re looking to see how well your site is converting visitors or what visitors need to see before converting, these are the reports you’ll want to refer to.
This example report shows you a summary of the goals you have set and how often they are being completed. You will see goal completions by day, goal type, and completion locations.

Use this information to look for patterns and see if there are certain days users are more likely to convert. If so, try to focus on the marketing you put out on those days. Analyze whether or not your site is leading to the completion of the goals you have set.
Conclusion
Google Analytics provides nearly endless amounts of information about your website’s data. Once you set up Google Analytics on your website, you can access metrics covering nearly every part of your customers’ journeys.
You can create custom reports to analyze how well your strategies work. This may help you make informed changes to your website, which may, in turn, draw even more people to your brand via your analytics-driven marketing strategy.
More like this: